This is the second part of a two-part series on metrics-first observability. Part one, Metrics-First Observability: A Conceptual Model, covered why metrics should lead and what to measure. This part covers how to operate a metrics-first program in practice.
Operating Model for Metric-First Observability
Metric-first observability also requires a clear operating model.
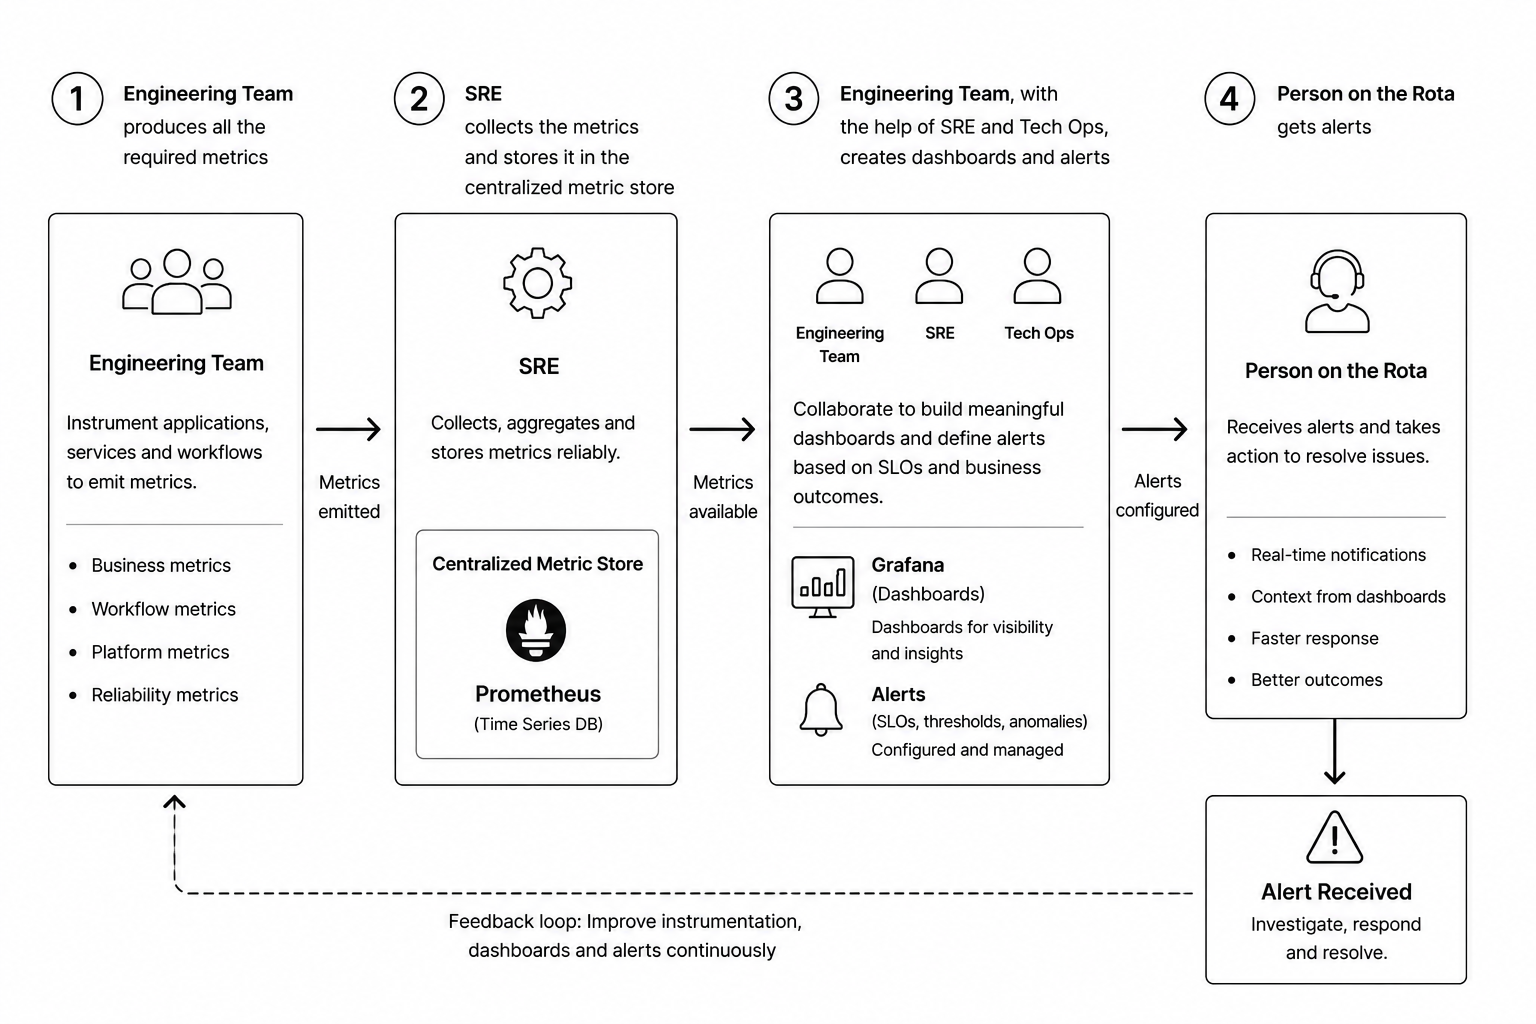
The engineering team is responsible for producing the required metrics. Metrics should be part of the application design, not an afterthought.
SRE is responsible for collecting, aggregating, and storing those metrics in a centralized metric store such as Prometheus or an equivalent platform.
Engineering, SRE, and Tech Ops should collaborate to create dashboards and alerts. These dashboards should represent both technical health and business health.
Finally, the person on the rota receives alerts when business or platform SLOs are breached.
The flow looks like this:
- Engineering instruments applications, services, and workflows.
- SRE collects and stores metrics centrally.
- Engineering, SRE, and Tech Ops create dashboards and alerts.
- The person on rota receives alerts and responds.
- Learnings from incidents improve future metrics, dashboards, and alerts.
This creates a continuous feedback loop.
Moving from Log-First to Metric-First Observability
Moving from log-first observability to metric-first observability is not only a tooling change. It requires engineering discipline, clear ownership, naming standards, retention rules, alert classification, and escalation paths.
Metrics should be designed with the same care as APIs, database schemas, and event contracts.
1. Make Metrics Part of the Original Design
Developers are responsible for adding meaningful metrics while writing the code. Metrics should not be added later as an operational afterthought.
For every critical workflow, developers should ask:
- What does success look like?
- What does failure look like?
- What does delay look like?
- What business dimension matters?
- What metric would help us detect degradation before customers or downstream systems are affected?
For example, in a payment workflow, the application should emit metrics for payments received, payments released, payments failed, payments delayed, retry counts, and SLA breaches.
2. Establish a Metric Naming Convention
A consistent naming convention makes metrics easier to discover, query, dashboard, and alert on.
A good metric name should clearly describe:
- The domain
- The application or service
- The workflow
- The measured behavior
- The unit of measurement
For example:
payments.stp.release.duration.seconds
payments.stp.release.count
payments.stp.release.failure.count
cdc.instruction.target.row_count
cdc.instruction.source.row_count
The goal is to make metrics understandable without requiring tribal knowledge.
3. Control Cardinality
Metric cardinality must be carefully controlled. High-cardinality labels can overwhelm the metric store, increase cost, and degrade query performance.
As a rule, developers should avoid using unbounded values as tags.
Avoid tags such as:
- Customer ID
- Account number
- Payment ID
- Transaction ID
- Order ID
- Email address
- User ID
Prefer bounded tags such as:
- State code
- Region
- Currency
- Payment rail
- Environment
- Application name
- Error category
- Workflow status
For example, state_code=NJ is usually safe because the number of possible values is finite. But customer_id=123456 is unsafe because the number of possible values can grow without limit.
The principle is simple:
Use metrics to understand system behavior in aggregate. Use logs or traces to investigate individual records.
When you need to connect an aggregate metric spike to a specific request or event, exemplars (supported by Prometheus and other backends) let you link a metric data point to a trace or log sample—without putting high-cardinality IDs on the metric itself.
4. Define Metric Retention Periods
Not every metric needs to be stored forever. Retention should be based on operational value, regulatory needs, cost, and trend-analysis requirements.
A practical retention model could look like this:
- High-resolution operational metrics: 15 to 30 days
- Aggregated hourly metrics: 3 to 6 months
- Daily business SLO metrics: 12 to 24 months
- Audit or compliance-related metrics: based on organizational policy
For example, second-by-second JVM or Kafka consumer metrics may only be useful for recent troubleshooting. But daily payment SLA metrics may be useful for trend analysis, capacity planning, and business reviews.
5. Classify Alerts by Severity
Not every alert should wake up the person on rota. Alerts should be classified based on business impact and urgency.
A simple model could be:
- FYI — Informational; no immediate action required. Email or dashboard only.
- WARN — Degradation detected; action may be needed during business hours.
- URGENT — Business-impacting issue; notify the person on rota.
- CRITICAL — Major outage, data-loss risk, or severe business impact; page rota and escalate.
For example:
- A small increase in retry count may be WARN.
- More than 0.5% of STP payments taking longer than one minute may be URGENT.
- A CDC pipeline stopped for a critical payment table may be CRITICAL.
6. Define Alert Recipients
Alert routing should be intentional.
The person on rota should receive actionable alerts that require immediate response. But not every notification should go to the rota.
Teams should define:
- Who gets FYI emails?
- Who gets WARN alerts?
- Who gets URGENT rota calls?
- Who gets CRITICAL escalation notifications?
- Which support or operations DL should receive incident visibility?
It is often better to create a dedicated support or operations distribution list instead of using the general engineering DL. Engineering DLs are usually too broad and can create unnecessary noise. A focused support DL keeps the right people informed without overwhelming the entire team.
7. Define Escalation Rules
Every alert should have a clear escalation path.
For example:
- Alert goes to the person on rota.
- If not acknowledged within 10 minutes, escalate to secondary rota.
- If still unresolved or business impact increases, escalate to the application owner.
- For major incidents, notify Tech Ops, SRE, business stakeholders, and incident management.
- After resolution, conduct a review and improve metrics, dashboards, and alerts.
The escalation path should be documented before the incident happens.
8. Avoid Alert Fatigue
Alert fatigue is one of the biggest risks in observability programs. If engineers receive too many noisy or low-value alerts, they eventually stop trusting the alerting system.
To avoid alert fatigue:
- Alert on symptoms, not every internal cause.
- Prefer business-impacting alerts over purely technical noise.
- Use thresholds based on rolling windows, not single-point spikes.
- Add suppression rules for known maintenance windows.
- Deduplicate related alerts.
- Review alert quality after every incident.
- Remove or downgrade alerts that do not require action.
A good alert should be actionable. If nobody knows what to do when an alert fires, the alert is not ready.
The goal is not to create more alerts. The goal is to create fewer, better, more meaningful alerts.
Metric-first observability works only when metrics are designed, governed, retained, and alerted on with discipline.
Conclusion
Metric-first observability is as much an operating discipline as a technical choice. Clear ownership, consistent naming, controlled cardinality, deliberate retention, severity-based alerting, intentional routing, documented escalation, and a constant fight against alert fatigue are what turn a collection of metrics into a system that teams trust during incidents.
For the concepts behind this operating model—why metrics should lead, and what to measure across business, workflow, platform, and reliability dimensions—see part one: Metrics-First Observability: A Conceptual Model.