Why Logs Should Support, Not Lead
In many engineering organizations, observability starts with logs. When something breaks, engineers open log search tools, filter by timestamps, scan error messages, and try to reconstruct what happened.
Logs are useful. But they should not be the primary way to understand whether a system is healthy.
In modern distributed systems, especially event-driven systems, observability should start with metrics. Metrics should be treated as first-class citizens. Logs should provide supplementary context to debug incidents, explain failures, and support root-cause analysis.
In simple terms:
Metrics should tell us that something is wrong. Logs should help us understand why.
The Problem with Log-First Operations
A log-first operating model does not scale well.
Logs are often noisy, expensive, and difficult to interpret. They are useful when an engineer already knows where to look, but they are not always effective at showing the overall health of a system.
Cost is another major issue. Many observability vendors charge based on how much data is indexed, ingested, or stored. In many systems, the majority of logs are rarely searched, but teams still pay to collect, index, retain, and query them. This creates a model where organizations pay for large volumes of low-value data, even though only a small percentage of those logs are useful during real incidents.
Logs can also introduce privacy and compliance risks. When developers accidentally write sensitive business data, customer information, or PII into logs, that data may get indexed, replicated, retained, and exposed to a wider audience than intended. A log-first model can therefore increase not only operational cost, but also data-governance risk.
Logs can also affect runtime performance. In high-throughput, event-driven systems, excessive logging can introduce synchronous disk I/O, network serialization, and large payload-processing overhead. Under peak load, this can directly compete with the application’s core business processing.
Consider an algorithmic trading system. The system may process thousands or millions of market events, orders, and executions in a very short time window. If every event produces heavy log payloads, the logging path itself can become a bottleneck. In extreme cases, the system may spend more time formatting, serializing, shipping, and storing logs than processing the actual business event.
This does not mean logs should be removed. It means logs should be intentional, lightweight, and supplementary. High-volume systems should rely on well-designed metrics to understand health, throughput, latency, and failure rates, while using logs selectively for investigation.
In a distributed platform, one business transaction may pass through multiple services, queues, databases, APIs, and downstream systems. Searching logs across all those components during an incident is slow and reactive.
A log-first system often tells the story only after the damage is done.
Metric-first observability changes that model. Instead of waiting for someone to search through logs, the system continuously exposes its health through meaningful signals.
What Metric-First Observability Means
Metric-first observability means every critical system, service, and workflow is designed to emit meaningful metrics from the beginning.
These metrics should cover multiple dimensions:
- Business metrics — payments processed, payments failed, payments delayed, payments pending approval
- Workflow metrics — stuck states, retry counts, SLA breaches, lifecycle transition delays
- Platform metrics — Kafka lag, consumer errors, API latency, database latency
- Reliability metrics — availability, error rate, saturation, recovery time
The goal is not just to know whether servers are running. The goal is to know whether the business process is working as expected.
The best observability systems do not only tell us whether the platform is running. They tell us whether the business process is meeting its promise.
Why This Matters More in Event-Driven Systems
Metric-first observability becomes even more important in event-driven distributed systems.
In a synchronous system, failure is often visible immediately. A request fails, an API returns an error, and the caller knows something went wrong.
But in an event-driven system, everything operates asynchronously. A producer may successfully publish an event, but that does not mean the business workflow has completed. A consumer may face delays, or a message may transparently retry; meanwhile, a downstream system rejects the event, leaving a payment quietly stuck in an intermediate state.
In asynchronous systems, success at one step does not guarantee success of the workflow.
That is why metrics are critical. Metrics connect the dots across producers, topics, consumers, databases, and downstream systems.
For example, an event-driven platform should expose metrics such as:
- Events published per minute
- Events consumed per minute
- Consumer lag by topic and consumer group
- Event processing latency
- Retry count
- Dead-letter queue count
- Failed event count by reason
- Workflow completion time
- Business SLA breach count
In an event-driven architecture, the absence of an error does not mean the presence of success. Only metrics can prove that the workflow is moving forward.
Metrics, Traces, and Logs
Metric-first does not mean logs are unimportant. It means logs should play the right role.
A useful mental model is:
Metrics are the dashboard. Traces are the map. Logs are the evidence.
Metrics show the health of the system. Traces show the path of a request or event. Logs explain the details.
When an alert fires, the engineer should first understand the impact through metrics and dashboards. Then traces and logs can help explain the root cause.
Business SLO-Driven Metrics
Metric-first observability should also support business SLOs.
For example, in a payment platform, it is not enough to know that Kafka is healthy or that APIs are responding. The real question is:
Are payments moving through the business workflow within the expected time?
For an STP payment flow, we may define a business SLO like this:
99.5% of eligible STP payments should be released within one minute.
That SLO can be translated into alertable metrics:
- Total STP payments processed
- STP payments are released within one minute
- STP payments are taking more than one minute
- Percentage of delayed STP payments
- Delayed payments by client, currency, region, rail, or payment type
An alert rule could be:
If more than 0.5% of STP payments take longer than one minute to release within a defined rolling window, alert the rota.
This is powerful because the alert is based on business degradation, not just technical failure.
Metric-First Observability for Change Data Capture
Change Data Capture is another strong example.
In a CDC pipeline, data moves asynchronously from a source system to a target system. The source write may succeed, the CDC connector may capture the change, the event may be published, and the target database may eventually apply it.
Each step can fail or lag independently.
That is why CDC observability should not depend only on logs. Logs can explain why a specific record failed, but metrics should tell us whether the pipeline is healthy.
Important CDC metrics include:
- Source table row count
- Target table row count
- Source-to-target row-count mismatch
- CDC lag
- Events captured per minute
- Events applied per minute
- Failed apply count
- Retry count
- Dead-letter count
- Last successful sync timestamp
A simple but powerful control is comparing the source and target row counts. If the source table has 1,000,000 rows and the target table has 999,500 rows, the system should not wait for an engineer to discover that manually.
A metric should capture the mismatch, and an alert should notify the rota.
In CDC pipelines, correctness is not just about whether events are moving. It is about whether the target system faithfully represents the source system.
Operating Model for Metric-First Observability
Metric-first observability also requires a clear operating model.
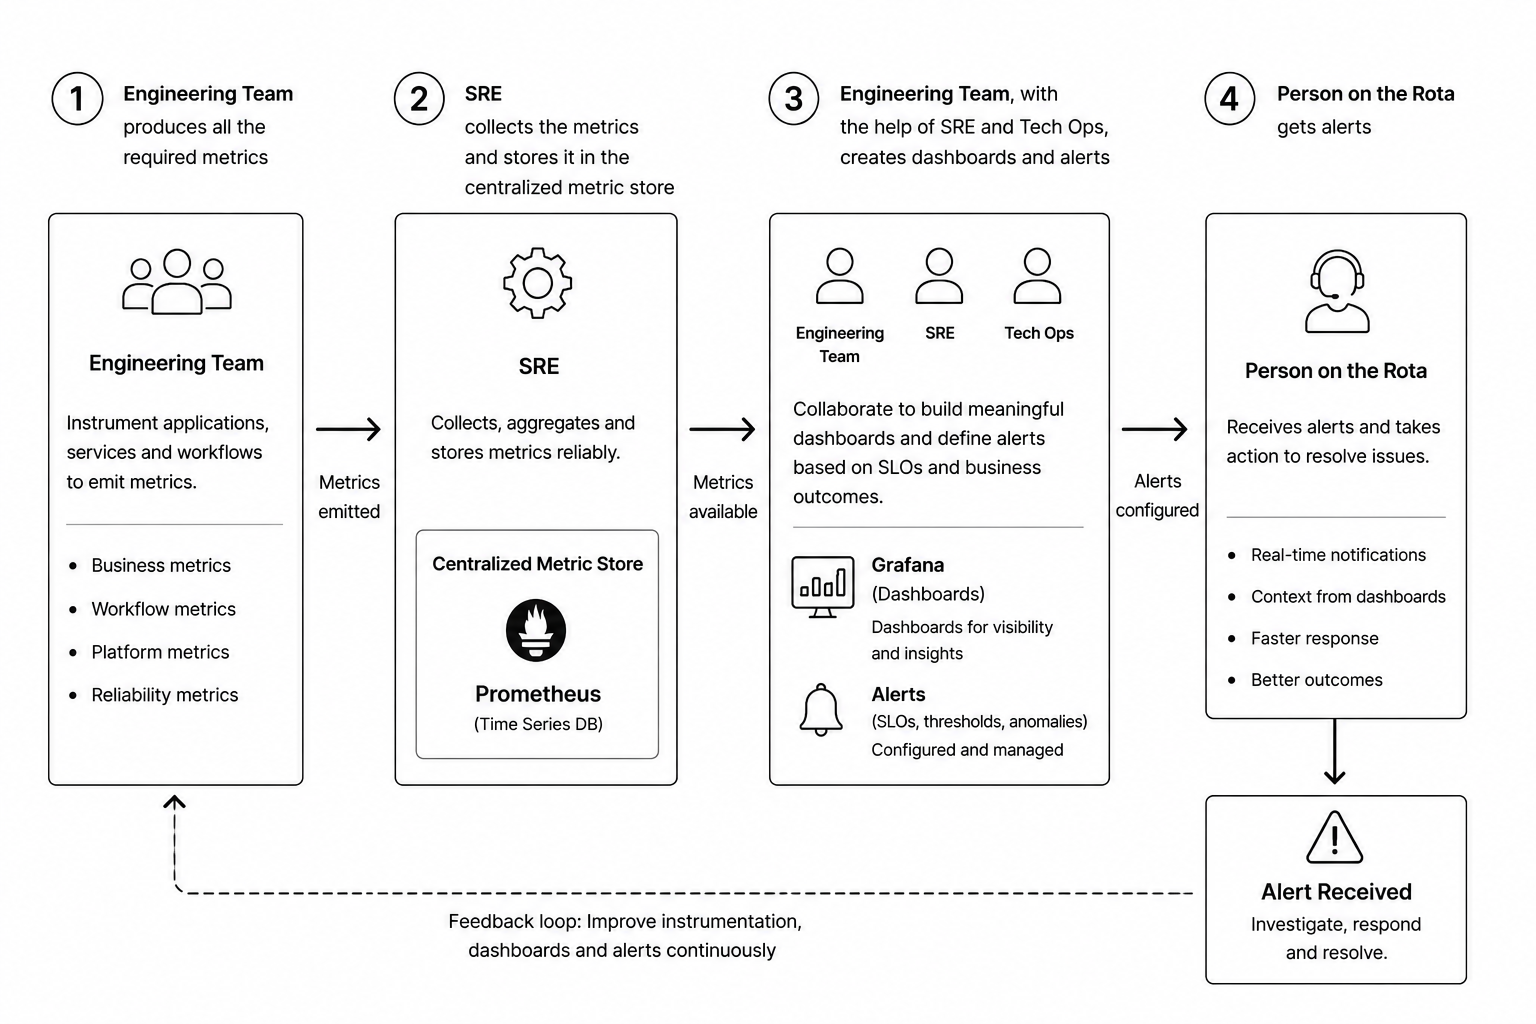
The engineering team is responsible for producing the required metrics. Metrics should be part of the application design, not an afterthought.
SRE is responsible for collecting, aggregating, and storing those metrics in a centralized metric store such as Prometheus or an equivalent platform.
Engineering, SRE, and Tech Ops should collaborate to create dashboards and alerts. These dashboards should represent both technical health and business health.
Finally, the person on the rota receives alerts when business or platform SLOs are breached.
The flow looks like this:
- Engineering instruments applications, services, and workflows.
- SRE collects and stores metrics centrally.
- Engineering, SRE, and Tech Ops create dashboards and alerts.
- The person on rota receives alerts and responds.
- Learnings from incidents improve future metrics, dashboards, and alerts.
This creates a continuous feedback loop.
Moving from Log-First to Metric-First Observability
Moving from log-first observability to metric-first observability is not only a tooling change. It requires engineering discipline, clear ownership, naming standards, retention rules, alert classification, and escalation paths.
Metrics should be designed with the same care as APIs, database schemas, and event contracts.
1. Make Metrics Part of the Original Design
Developers are responsible for adding meaningful metrics while writing the code. Metrics should not be added later as an operational afterthought.
For every critical workflow, developers should ask:
- What does success look like?
- What does failure look like?
- What does delay look like?
- What business dimension matters?
- What metric would help us detect degradation before customers or downstream systems are affected?
For example, in a payment workflow, the application should emit metrics for payments received, payments released, payments failed, payments delayed, retry counts, and SLA breaches.
2. Establish a Metric Naming Convention
A consistent naming convention makes metrics easier to discover, query, dashboard, and alert on.
A good metric name should clearly describe:
- The domain
- The application or service
- The workflow
- The measured behavior
- The unit of measurement
For example:
payments.stp.release.duration.seconds
payments.stp.release.count
payments.stp.release.failure.count
cdc.instruction.target.row_count
cdc.instruction.source.row_count
The goal is to make metrics understandable without requiring tribal knowledge.
3. Control Cardinality
Metric cardinality must be carefully controlled. High-cardinality labels can overwhelm the metric store, increase cost, and degrade query performance.
As a rule, developers should avoid using unbounded values as tags.
Avoid tags such as:
- Customer ID
- Account number
- Payment ID
- Transaction ID
- Order ID
- Email address
- User ID
Prefer bounded tags such as:
- State code
- Region
- Currency
- Payment rail
- Environment
- Application name
- Error category
- Workflow status
For example, state_code=NJ is usually safe because the number of possible values is finite. But customer_id=123456 is unsafe because the number of possible values can grow without limit.
The principle is simple:
Use metrics to understand system behavior in aggregate. Use logs or traces to investigate individual records.
4. Define Metric Retention Periods
Not every metric needs to be stored forever. Retention should be based on operational value, regulatory needs, cost, and trend-analysis requirements.
A practical retention model could look like this:
- High-resolution operational metrics: 15 to 30 days
- Aggregated hourly metrics: 3 to 6 months
- Daily business SLO metrics: 12 to 24 months
- Audit or compliance-related metrics: based on organizational policy
For example, second-by-second JVM or Kafka consumer metrics may only be useful for recent troubleshooting. But daily payment SLA metrics may be useful for trend analysis, capacity planning, and business reviews.
5. Classify Alerts by Severity
Not every alert should wake up the person on rota. Alerts should be classified based on business impact and urgency.
A simple model could be:
- FYI — Informational; no immediate action required. Email or dashboard only.
- WARN — Degradation detected; action may be needed during business hours.
- URGENT — Business-impacting issue; notify the person on rota.
- CRITICAL — Major outage, data-loss risk, or severe business impact; page rota and escalate.
For example:
- A small increase in retry count may be WARN.
- More than 0.5% of STP payments taking longer than one minute may be URGENT.
- A CDC pipeline stopped for a critical payment table may be CRITICAL.
6. Define Alert Recipients
Alert routing should be intentional.
The person on rota should receive actionable alerts that require immediate response. But not every notification should go to the rota.
Teams should define:
- Who gets FYI emails?
- Who gets WARN alerts?
- Who gets URGENT rota calls?
- Who gets CRITICAL escalation notifications?
- Which support or operations DL should receive incident visibility?
It is often better to create a dedicated support or operations distribution list instead of using the general engineering DL. Engineering DLs are usually too broad and can create unnecessary noise. A focused support DL keeps the right people informed without overwhelming the entire team.
7. Define Escalation Rules
Every alert should have a clear escalation path.
For example:
- Alert goes to the person on rota.
- If not acknowledged within 10 minutes, escalate to secondary rota.
- If still unresolved or business impact increases, escalate to the application owner.
- For major incidents, notify Tech Ops, SRE, business stakeholders, and incident management.
- After resolution, conduct a review and improve metrics, dashboards, and alerts.
The escalation path should be documented before the incident happens.
8. Avoid Alert Fatigue
Alert fatigue is one of the biggest risks in observability programs. If engineers receive too many noisy or low-value alerts, they eventually stop trusting the alerting system.
To avoid alert fatigue:
- Alert on symptoms, not every internal cause.
- Prefer business-impacting alerts over purely technical noise.
- Use thresholds based on rolling windows, not single-point spikes.
- Add suppression rules for known maintenance windows.
- Deduplicate related alerts.
- Review alert quality after every incident.
- Remove or downgrade alerts that do not require action.
A good alert should be actionable. If nobody knows what to do when an alert fires, the alert is not ready.
The goal is not to create more alerts. The goal is to create fewer, better, more meaningful alerts.
Metric-first observability works only when metrics are designed, governed, retained, and alerted on with discipline.
Conclusion
Metric-first observability changes how teams operate distributed systems. Instead of searching logs after something breaks, teams define meaningful metrics upfront. These metrics continuously expose the health of business workflows, event pipelines, CDC processes, and platform components. Logs still matter. They help explain incidents and support debugging. But they should not be the starting point. In modern event-driven systems, observability should begin with metrics.
The log should complete the story, not start it.
Appendix
High-Resolution vs Low-Resolution
| Area | High-Resolution Metrics | Low-Resolution Metrics |
|---|---|---|
| Meaning | Metrics captured at very small intervals | Metrics aggregated over larger intervals |
| Typical interval | Every 5, 10, 15, or 30 seconds | Every 5 minutes, hourly, daily, or monthly |
| Main purpose | Recent incident debugging and real-time operations | Trend analysis, capacity planning, and reporting |
| Example | API latency every 10 seconds | Hourly average API latency |
| Example | Kafka consumer lag every 30 seconds | Daily maximum Kafka consumer lag |
| Example | JVM memory usage every 15 seconds | Daily average JVM memory usage |
| Example | Error rate per minute | Monthly error-rate trend |
| Retention | Usually 15–30 days | Usually 3 months to multiple years |
| Cost | Higher storage and query cost | Lower storage and query cost |
| Best for | “What happened during the incident?” | “How is the system trending over time?” |
Blackbox vs Whitebox
| Area | Blackbox Metrics | Whitebox Metrics |
|---|---|---|
| Meaning | Metrics observed from outside the system | Metrics emitted from inside the application or service |
| Main question answered | “Is the system working for users?” | “Why is the system behaving this way?” |
| Perspective | User/client/external perspective | Internal application/platform perspective |
| Examples | API availability, response time, error rate | JVM memory, thread count, DB pool usage, Kafka lag |
| Payment example | Can a payment be submitted successfully? | How long did validation, approval, and release steps take? |
| CDC example | Is the target table updated within SLA? | CDC lag, retry count, failed apply count, DLQ count |
| Best for | Detecting user-visible or business-visible impact | Diagnosing internal causes and bottlenecks |
| Alert usage | Good for urgent/page alerts | Good for investigation, warning, and root-cause analysis |
| Limitation | May not explain the root cause | May miss real user/business impact if used alone |
| Simple summary | Measures outcomes | Explains internals |